All downloads below are archived in ZIP format. To extract these archives, you must have WinZip or similar installed on your system.
Summary of sites
Location | Site(s) | Data | @ Planimetric Resolutions of ... |
[X1, Y1, Z1, I1, X2, Y2, Z2, I2] |
| ||
[X1, Y1, Z1, I1, X2, Y2, Z2, I2] |
| ||
[X1, Y1, Z1, I1, X2, Y2, Z2, I2] |
| ||
[X1, Y1, Z1, I1, X2, Y2, Z2, I2] |
|
Eight sites have been chosen for comparing the performance of filters. Four represent urban landscapes (City Sites ) and the other four represent rural landscapes (Forest Sites ). The point density for the City and Forest sites are roughly 0.67 and 0.18 points per square metre respectively. Associated with each Site is one zip file, except for Sites 1 and 8 which have two extra zip files each. Each zip file contains one text file. Each text file represents first and last pulse returns.
Sites 1 and 8 as mentioned above have associated with them two extra zip files. The data in the extra zip files are the same except in resolution (lower resolution). The lower resolution data was obtained by selecting the Nth point along the Nth scanline. In this way the original data was reduced for N = 2 and N = 4.
For Site 1 the reduction gives a point density of roughly 0.18 and 0.04 for N = 2 and N = 4 respectively. Also for Site 8 the reduction gives a point density of roughly 0.05 and 0.01 for N = 2 and N = 4 respectively.
The suffix (last three letters) in the name of each file indicates the resolution of the data it contains. The suffixes are _orig, _red1, and _red2. They stand for Original, Reduction by 1 (N = 2), and Reduction by 2 (N = 4) respectively. For example, file CSite1_red1.txt is a reduction of the original data by keeping only the 2nd point along the 2nd scanline.
Each text file is a space delimited point list. Every record represents two points (first and last return) and four data items are provided for each point in the record:
Sample:
...
...
...
495246.77 5420160.76 251.33 192 495246.77 5420160.78 251.25 192
495246.73 5420163.65 251.26 193 495246.73 5420163.66 251.20 193
495246.69 5420166.65 251.31 290 495246.69 5420166.65 251.31 290
495246.65 5420169.67 251.32 192 495246.65 5420169.68 251.27 192
495246.61 5420172.70 251.29 290 495246.61 5420172.71 251.23 290
495246.57 5420175.73 251.27 290 495246.57 5420175.73 251.23 290
495246.53 5420178.63 251.22 290 495246.53 5420178.64 251.15 290
495246.49 5420181.52 251.23 319 495246.49 5420181.53 251.18 319
495246.45 5420184.68 251.33 348 495246.45 5420184.68 251.34 348
495246.41 5420187.73 251.31 290 495246.41 5420187.73 251.29 290
...
...
...
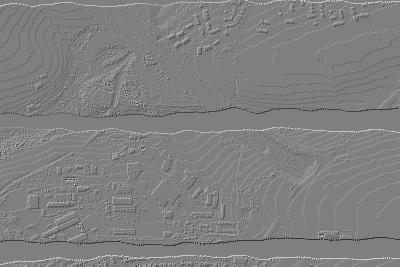
City sites
Site | Data Bounds | 3D View | ||
Site 1 | X min | 512050 |
|
|
Y min | 5403440 | |||
X max | 513150 | |||
Y max | 5404100 | |||
Original - (11.1 MB) | ||||
Reduction (1) - (4.4 MB) | ||||
Reduction (2) - (1.1 MB) | ||||
All - (16.6 MB) | ||||
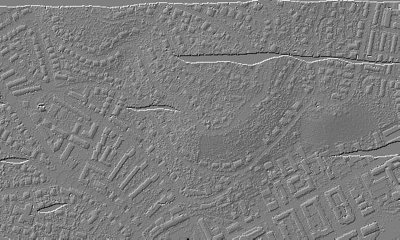
Features of interest:
| ||||
Site 2 | X min | 513450 |
|
|
Y min | 5402650 | |||
X max | 513870 | |||
Y max | 5403280 | |||
Original - (3.8 MB) | ||||
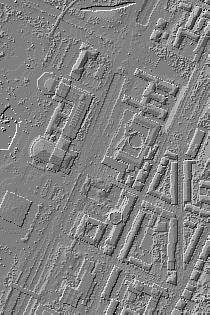
Features of interest:
| ||||
Site 3 | X min | 512023 |
|
|
Y min | 5403120 | |||
X max | 512549 | |||
Y max | 5403500 | |||
Original - (3.1 MB) | ||||
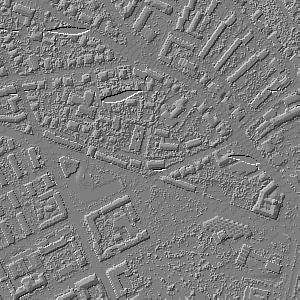
Features of interest:
| ||||
Site 4 | X min | 513120 |
|
|
Y min | 5403190 | |||
X max | 513630 | |||
Y max | 5403760 | |||
Original - (4.0 MB) | ||||
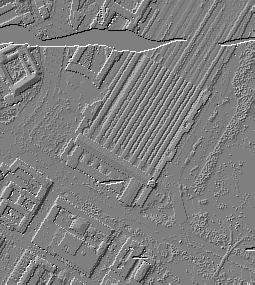
Features of interest:
| ||||
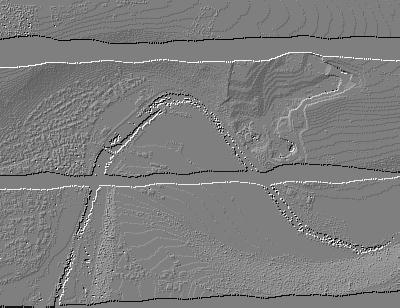
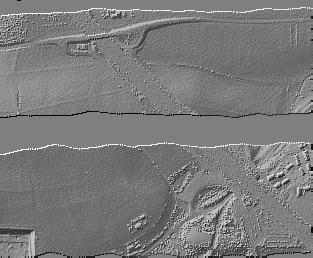
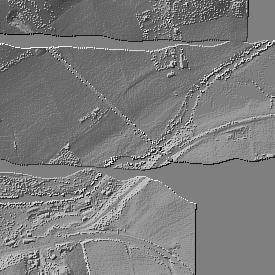
Forest sites
Site | Data Bounds | 3D View | ||
Site 5 | X min | 493650 |
|
|
Y min | 5419770 | |||
X max | 495250 | |||
Y max | 5421000 | |||
Original - (5.5 MB) | ||||
Image (tif file) - (4.2 MB) | ||||
Features of interest:
| ||||
Site 6 | X min | 496350 |
|
|
Y min | 5420750 | |||
X max | 497950 | |||
Y max | 5421817 | |||
Original - (4.7 MB) | ||||
Features of interest:
| ||||
Site 7 | X min | 495950 |
|
|
Y min | 5421350 | |||
X max | 497200 | |||
Y max | 5422380 | |||
Original - (3.4 MB) | ||||
Features of interest:
| ||||
Site 8 | X min | 499450 |
|
|
Y min | 5418330 | |||
X max | 500550 | |||
Y max | 5419430 | |||
Original - (3.0 MB) | ||||
Reduction (1) - (0.8 MB) | ||||
Reduction (2) - (0.2 MB) | ||||
All - (4.0 MB) | ||||
Features of interest:
| ||||
Reference data
For each of the samples that have been used for analysing the filtering results of the test participants the reference data is now available. This reference data has been compiled by semi-automatic filtering and manual editing. Each record in the reference data files contains the X, Y, and Z coordinates followed by either a 0 (ground point) or 1 (non-ground point).