Greetings from the Big Geodata Newsletter!
In this issue you will find information on how millions of Dask nodes are managed in production, cloud-native access to NetCDF datasets by using Kerchunk, insights into EuroCrops - an open-source dataset for European crop analysis, and advancements in geospatial foundation models for image analysis, particularly enhancing NASA-IBM Prithvi's domain adaptability!
Happy reading!
You can access the previous issues of the newsletter on our web portal. If you find the newsletter useful, please share the subscription link below with your network.
Scaling Dask in Production: Lessons from Managing Millions of Cluster
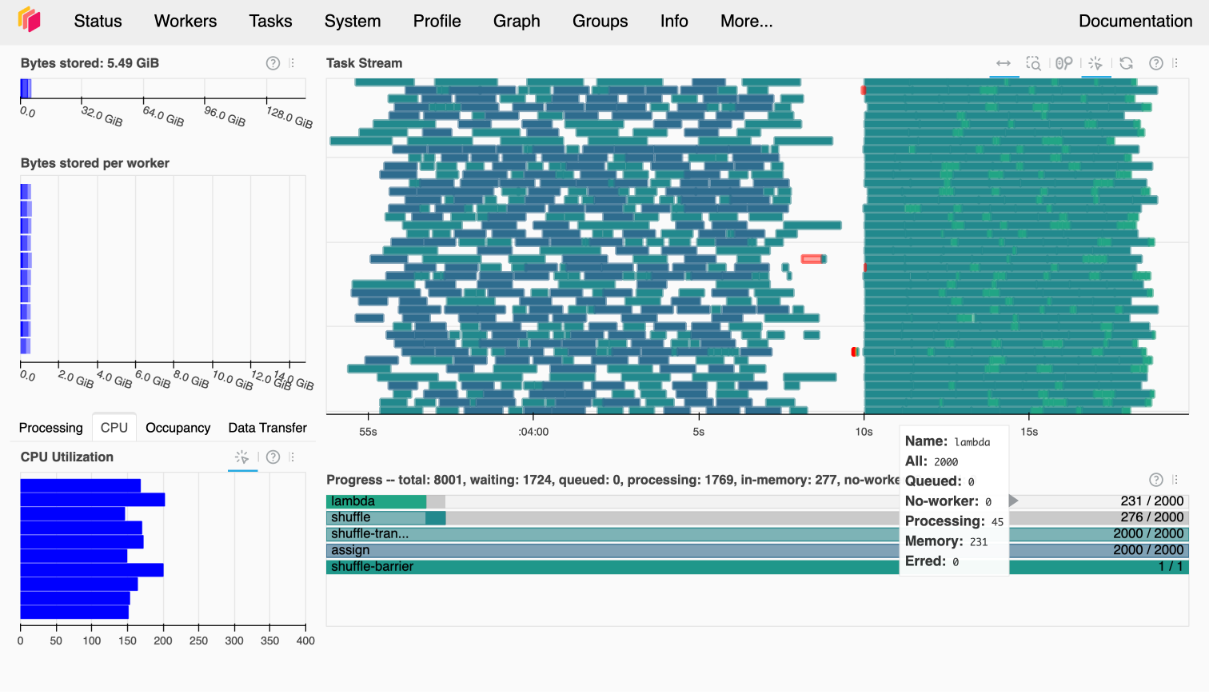
 Image credits: Coiled.io
Matthew Rocklin is primarily known for his work on Dask, and recently also for coiled.io which aims to enable cost-effective large-scale computing using Dask. For this purpose, they manage a cloud-based infrastructure. In his SciPy 2024 talk, Matther shares key insights from managing large-scale Dask clusters and executing billions of Python functions. He highlights the importance of Global Interpreter Lock (GIL) vigilance and explains why Kubernetes can be too complex for job-intensive tasks, while ARM architecture is an underused resource in cloud computing. Rocklin also discusses how Docker isn't ideal for data science workflows and stresses the significance of utilizing availability zones to maximize GPU and spot instance availability. He emphasizes that adaptive scaling is powerful but challenging, and most workloads are actually small and fast, with costs often being overestimated by users. Additionally, he shares insights on optimizing cloud infrastructure, reducing operational costs, and managing clusters more efficiently, all based on real-world data and metrics collected over years of working with Dask.
For more detailed information, check the video from SciPy 2024 here. If you are using Dask or planning to use it for your geospatial analysis tasks, knowing how the actual computation is taking place at the infrastructure level can help you to make you workflows more efficient.
Efficient Cloud-Optimized Access to NetCDF data with Kerchunk

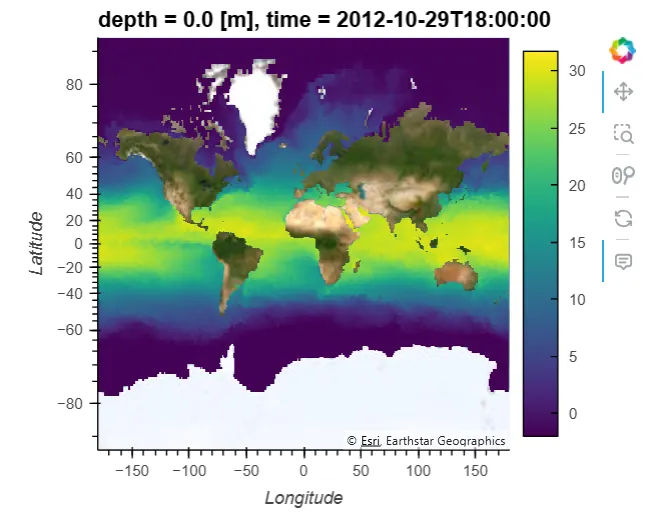
Image credits: Richard Signell, Medium
Researchers have developed an innovative method to efficiently access and analyze the HYCOM reanalysis dataset, a massive 285-terabyte collection of ocean data. Using the Kerchunk tool, they've created a "virtual dataset" that dramatically improves data access efficiency for uncompressed NetCDF files. Key innovations include splitting large data chunks into manageable "subchunks" and generating a template applicable to more than 63 thousand files in the dataset. This approach shows remarkable performance gains, allowing researchers to load global fields quickly and extract complete time series in minutes. The technique, demonstrated on ocean data, has potential applications across various scientific fields dealing with large, uncompressed datasets.
For more details on this approach, refer to the original blog post discussing the cloud-optimized approach to reading NetCDF files. Source code is also available on GitHub to encourage adoption and further innovation in the scientific community.
EuroCrops: Open-Source European Crop Data for Research and Analysis
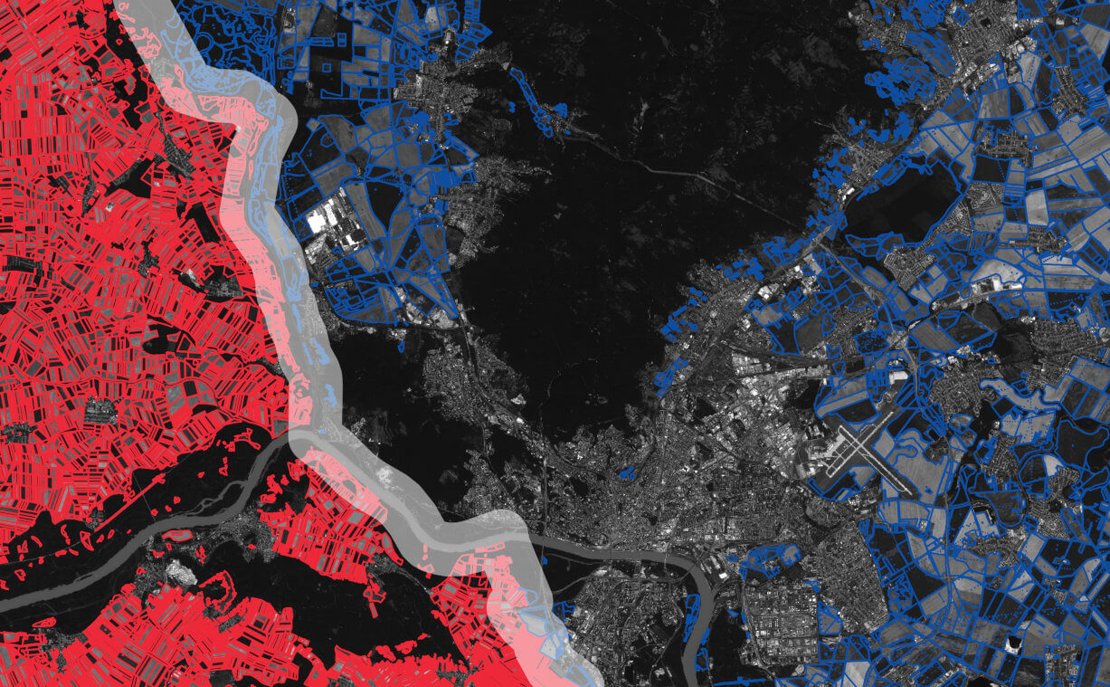
Image credits: Maja Schneider
EuroCrops is a dataset collection combining publicly available self-declared crop reporting data from European Union countries. The project, funded by the German Space Agency (DLR), aims to standardize agricultural data across Europe. It offers the information in various cloud-native geospatial formats, including GeoParquet, FlatGeobuf, and PMTiles, with both unprojected and projected versions available. The dataset enhances original country-specific data with consistent attributes such as translated crop names and hierarchical crop codes. Currently focused on vector data, there are plans to include satellite imagery in future versions.
EuroCrops can be used by researchers, policymakers, and professionals in fields related to agriculture and environmental studies. The data is accessible under a CC-BY 4.0 License. More information on the recent developments can be found in this repository and you can explore the dataset here.
Upcoming Meetings
- SURF Training: Introduction to Supercomputing
Online / SURF Amsterdam, 8-10 October 2024 - NVIDIA Training: Accelerating Python with GPUs
Online, 9 October 2024 - SURF Training: Introduction to Scientific Visualization with Blender
SURF Amsterdam, 15 October 2024 - National Open Science Festival
22 October 2024, Maastricht University - CRIB Training: Good Practices in Research Software Development
ITC, Enschede, 23 October 2024 - Call for Abstracts: ESA Living Planet Symposium
Vienna, Austria, 23-27 June 2025
Recent Releases
- PDAL: Point Data Abstraction Library
2.8.0 (5/9/2024) - scikit-learn: machine learning in Python
1.5.2 (11/9/2024) - PROJ: Cartographic Projections and Coordinate Transformations Library
9.5.0 (15/9/2024) - CGAL: Computational Geometry Algorithms Library
6.0 (27/9/2024)
The "Big" Picture
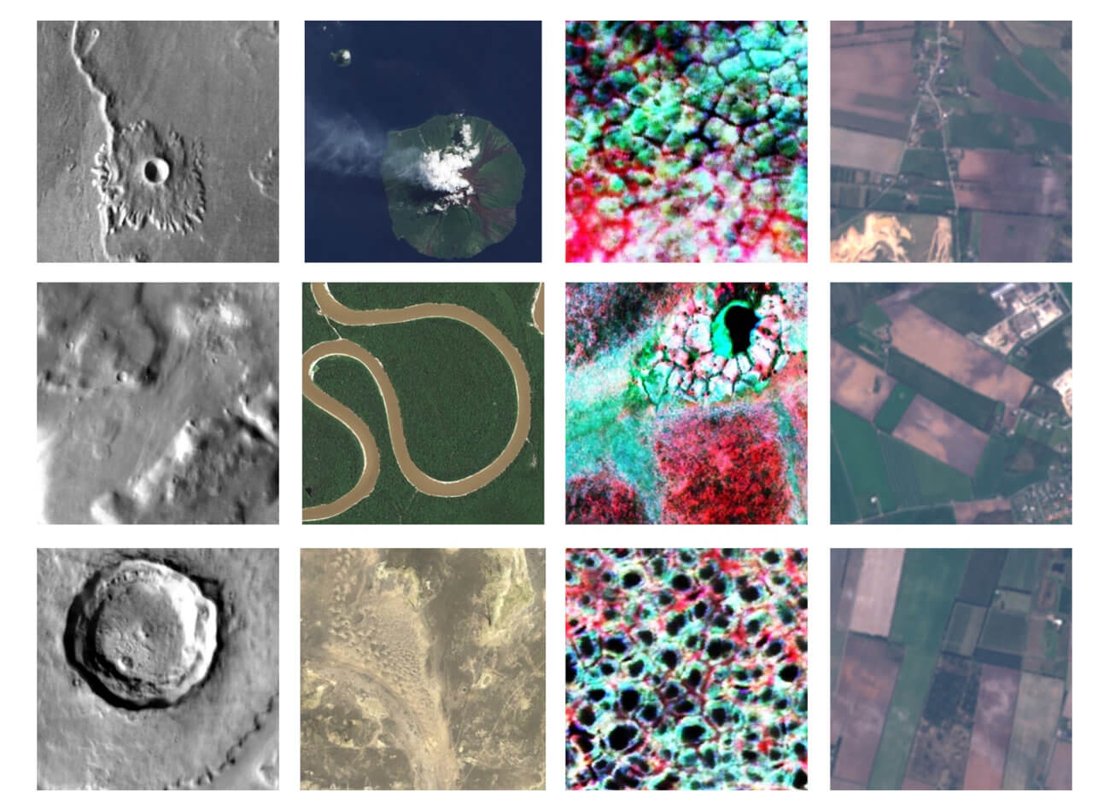
Image credits: Hsu et al., 2024
In the study of NASA-IBM’s Prithvi model, several methods were used to assess and enhance its performance on geospatial tasks. The study highlights Prithvi's strengths in extracting geospatial insights from multi-spectral data and its performance in tasks like object detection and segmentation compared to other AI models. The researchers designed an image analysis pipeline incorporating multiple backbone models to improve Prithvi’s domain adaptability. Key strategies included patch embedding for better data handling and multi-scale feature generation to refine feature extraction. Additionally, they introduced a band adaptation technique to make Prithvi compatible with datasets of varying spectral bands. Four benchmark datasets, Mars Crater Dataset, Earth’s Natural Features Dataset, Ice-Wedge Polygon Dataset, and EuroCrops Dataset, featuring environmental and land use characteristics were used for tests, which indicate better predictive performance and adaptation to different geospatial tasks.
The study's supporting materials, including both the dataset and associated code, have been made publicly available. These resources can be accessed through the figshare.
Hsu, C., Li, W., and Wang, S. (2024) Geospatial foundation models for image analysis: evaluating and enhancing NASA-IBM Prithvi’s domain adaptability. International Journal of Geographical Information Science, 1–30. doi:10.1080/13658816.2024.2397441